Walk-Forward Analysis: The Right Way to Validate a Trading Strategy
A single in-sample/out-of-sample split feels rigorous — it isn't. Walk-forward analysis is the only test that mimics how a strategy actually ages in the market.
Most traders backtest on every bar they have, pick the parameters that look best, and call it validated. That is not validation. That is the strategy memorizing the answer key.
Walk-forward analysis is the systematic antidote. It forces your strategy to prove itself on data it has never seen — repeatedly, across different market regimes — before you trust it with real capital. If the edge collapses the moment you hide future data, it was never there.
This article explains exactly how walk-forward testing works, what the results actually tell you, and the mistakes that turn a rigorous test into a rubber stamp.
Why a Single In-Sample Backtest Is Not a Validation
When you optimize a strategy's parameters on the same data you measure it on, the optimization will always find something that looks good. Given enough parameters and enough bars, a random price series can be fit to a spectacular equity curve. That is not skill — that is the curve-fitting trap that kills optimized strategies the moment they go live.
The core problem: the data is doing double duty. It is being used to both discover the parameters and evaluate the parameters. Those two jobs must be separated.
Out-of-sample testing solves this in principle — hold back 20–30% of your data, optimize on the rest, test on the holdout. But a single holdout is fragile. You get one data point, often during a specific regime, and the temptation to peek and re-optimize is enormous. Walk-forward testing is the rigorous version of the same idea, applied repeatedly and systematically.
How Walk-Forward Analysis Works
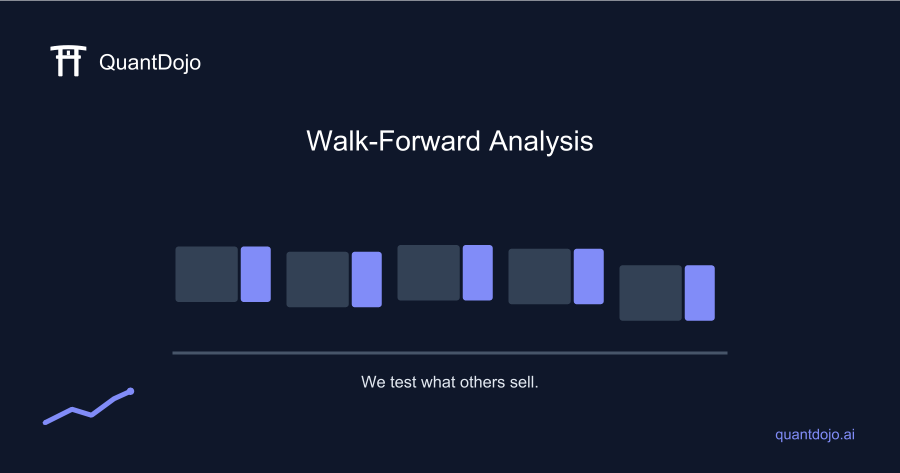
The mechanics are straightforward. You define two window sizes:
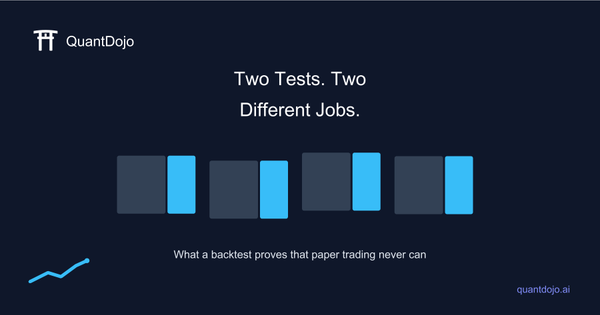
- In-sample (IS) window — the training period. The strategy is optimized here.
- Out-of-sample (OOS) window — the test period immediately following. No optimization, no peeking.
The windows then step forward through your full dataset in increments, generating a series of IS/OOS pairs. At each step:
- Optimize parameters on the IS segment to find the best-performing configuration.
- Apply those exact parameters, unchanged, to the OOS segment.
- Record the OOS equity curve segment.
- Slide the window forward and repeat.
When every OOS segment has been collected, stitch them end-to-end. The result is the composite out-of-sample equity curve — the only equity curve that approximates what live trading would have looked like, because each bar was traded with parameters that could legitimately have been known at the time.
Anchored vs. Rolling Windows
There are two common window configurations, and they answer slightly different questions.
Rolling (fixed-length) windows move the IS start date forward with each step. The IS window is always the same size. This stresses the strategy across different market regimes and tests whether recent data alone is sufficient to parameterize the model.
Anchored (expanding) windows keep the IS start date fixed and grow the in-sample period with each step. This assumes more data is always better and rewards parameters that remain stable as the dataset grows. Anchored walk-forward tends to be more conservative and is often appropriate when you have limited history.
Neither is universally superior. If your strategy's optimal parameters shift dramatically depending on which years are in the IS window, that is a signal — not a problem to optimize away.
What the Results Actually Tell You
The composite OOS curve is your primary verdict. But there are three specific metrics worth examining carefully.
OOS vs. IS Performance Ratio
Compare the Sharpe ratio (or net profit, or whatever metric guided your optimization) across IS and OOS segments. A rough rule: if OOS performance is less than roughly 50–60% of IS performance, the strategy is likely over-parameterized. Perfect parity is unrealistic — markets change. A catastrophic drop suggests curve-fitting. Understanding the Deflated Sharpe Ratio will help you interpret whether the OOS Sharpe is statistically meaningful given the number of trials you ran.
Parameter Stability Across Windows
After each IS optimization, record which parameter set "won." If the optimal parameters jump wildly from window to window — RSI length of 5 in 2018, 22 in 2020, 9 in 2022 — that is instability. Stable parameters that cluster around a consistent value suggest the model is capturing something structural. Erratic parameters suggest the optimizer is latching onto noise in each window.
Percent of Profitable OOS Segments
Count how many individual OOS windows were profitable. If 8 out of 10 windows made money, that is encouraging. If 4 out of 10 were profitable and the one spectacular window skews the composite curve positive, the "edge" may not be robust — it may be one regime the strategy happened to fit well. This connects directly to quantifying the probability of backtest overfitting: a strategy that only wins in a minority of OOS periods has a high probability of having gotten lucky.
Common Walk-Forward Mistakes
Walk-forward is rigorous — but it is not cheat-proof. Here is how traders undermine it.
- Too many re-runs. If you run walk-forward, dislike the result, tweak the strategy logic, and re-run, you are effectively re-using the OOS data as feedback. The OOS is contaminated. One final walk-forward on a strategy you believe in; not ten exploratory passes. This is the p-hacking problem wearing walk-forward clothing.
- OOS windows that are too short. A two-week OOS window is statistically meaningless. You want enough trades in each OOS segment to distinguish signal from noise — typically at least 30–50 trades per window as a minimum floor, more if the strategy trades infrequently.
- IS/OOS ratio extremes. An IS period of 5 years followed by a 1-week OOS produces an overfit monster. A 3-month IS feeding a 2-year OOS is undertrained garbage. Common starting points: 3:1 or 4:1 IS/OOS ratios, adjusted based on strategy frequency.
- Optimizing on the wrong metric. Maximizing net profit in-sample will find high-variance parameters that look great historically. Optimizing for risk-adjusted metrics — Sharpe, Calmar, or profit factor — tends to select more stable, generalizable parameters.
- Ignoring transaction costs in OOS. Whatever slippage and commission model you use must be consistent across IS and OOS. Strategies that barely survive realistic friction in OOS are not viable.
Walk-Forward vs. Monte Carlo: Different Questions
These two tools are frequently conflated. They are not substitutes.
Walk-forward analysis asks: does this strategy's parameter set generalize to unseen price data? It is a structural test — does the logic hold up in different time periods?
Monte Carlo simulation asks: given the trade distribution we observed, what is the range of possible outcomes, including ruin scenarios? It is a risk characterization test. Before risking live capital, you want both. Walk-forward confirms the edge might be real; Monte Carlo tells you whether the drawdown profile is survivable.
A Practical Walk-Forward Protocol
Here is a no-nonsense starting framework for most retail quant setups.
- Fix your strategy logic first. No further changes after walk-forward begins. Any change restarts the process.
- Use at least 5 OOS windows. Fewer and you cannot assess consistency.
- Run IS optimization on a robust metric — Sharpe ratio or profit factor, not raw PnL.
- Record the winning parameters for every IS window and plot them. Look for clustering.
- Evaluate the composite OOS curve on Sharpe, max drawdown, and percentage of profitable OOS segments.
- Compare IS and OOS Sharpe using the Deflated Sharpe framework to account for multiple testing.
- Stop here. If the strategy fails, kill it. Do not tweak and re-run.
Before you get to walk-forward, make sure the strategy clears a broader checklist. The Honest Backtest Checklist covers lookahead bias, survivorship bias, and data snooping — problems that walk-forward cannot fix if they are already embedded in your data or code.
Validate Faster with QuantCheck
Running a full walk-forward setup in code takes time. If you want a fast sanity check before committing to the full build, QuantCheck runs automated overfitting and parameter stability diagnostics on your backtest results — no coding required.
The QuantCheck app gives you a verdict immediately, no signup needed. It will not replace a thorough walk-forward, but it will tell you whether a strategy deserves the deeper investigation — before you spend a weekend building the infrastructure.
Frequently Asked Questions
How many walk-forward windows do I need for reliable results?
There is no universal answer, but fewer than five OOS windows produces results that are easy to dismiss statistically. Aim for at least five to eight windows with enough trades per OOS segment to make each window's result meaningful on its own. More windows are better, as long as each OOS segment is long enough to contain a representative sample of your strategy's trades.
Can walk-forward analysis be applied to any strategy type?
Walk-forward is most meaningful for parameter-dependent strategies — those with moving average lengths, RSI periods, stop distances, and similar numeric inputs that you optimize. If your strategy has no optimizable parameters, the concept still applies but reduces to a simple IS/OOS split rather than a rolling optimization procedure. High-frequency strategies with thousands of trades per window are the easiest to test this way; low-frequency strategies trading only a handful of times per year require much longer windows to produce statistically useful OOS segments.
Is walk-forward analysis enough on its own, or do I need other validation methods?
Walk-forward is necessary but not sufficient. It tests parameter generalization across time, but it does not account for the full distribution of possible trade sequences, path-dependent drawdown risk, or the number of strategies you tested before landing on this one. Combine it with Monte Carlo simulation to stress-test the drawdown profile, and use the probability of backtest overfitting framework to quantify how likely it is that your results are a statistical artifact of the search process itself.
The Honest Bottom Line
Walk-forward analysis does not guarantee a live strategy will work. Markets change; regimes end; correlations shift. What it does is remove one of the most common illusions in backtesting — the illusion that a beautifully optimized in-sample result means anything at all.
If the edge survives repeated exposure to data it has never seen, across different market conditions, with stable parameters, you have something worth investigating further. If it does not survive, you saved yourself real money.
Run the walk-forward. Trust the OOS curve. Kill strategies that fail it.
Nothing in this article is financial advice — it is a framework for being honest with yourself about whether your strategy has an edge.