The Curve-Fitting Trap: Why Your Optimized Strategy Dies the Moment It Goes Live
You ran the optimizer, found the best settings, and the backtest looks great. That's exactly the problem. Here's why optimized strategies die in live trading — and the two tests that catch it first.
Optimization is supposed to make your strategy better. What it usually makes better is the appearance of edge — until the market stops cooperating, which it does the moment you fund the account.
This is the curve-fitting trap. You run a parameter grid, the optimizer finds settings that crush the backtest, and you mistake a historical accident for a repeatable signal. The strategy isn't reading the market. It's memorizing it.
What Curve-Fitting in Trading Actually Means
Every strategy has parameters: a moving-average length, an RSI threshold, a stop-loss percentage. Each one is a dial you can turn. Optimization turns all those dials at once, searching for the combination that maximizes backtest performance.
The problem is that historical price data is finite and full of noise. Given enough dials and enough combinations, the optimizer will always find a setting that performs well historically — not because it found a real pattern, but because it found the exact noise fingerprint of your sample period. That's curve-fitting: fitting the model to the noise rather than to any underlying structure.
Add one parameter and you double your search space. Add five and you're exploring thousands of combinations. Every extra combination is another shot at hitting a lucky configuration that looks like skill.
This is the same multiple-testing problem that plagues academic research — and it's far more common in backtesting than most traders admit.
The Spiky vs. Flat Parameter Surface
Here's the single most useful diagnostic you can run after an optimization: plot the performance of neighboring parameter values, not just the best one.
A robust strategy produces a flat surface. If your best setting is a 14-period RSI and strategies with 12, 13, 15, and 16 periods also perform reasonably well, that's evidence the signal is real and the exact number doesn't matter much.
A curve-fit strategy produces a spiky surface. The optimizer found a single peak — 14-period RSI, stop at 1.37%, take-profit at 3.82% — and everything around it collapses. Move any dial by one notch and the backtest falls apart.
A spiky surface is telling you something important: the only way this strategy makes money is with exactly those numbers, calibrated to exactly this historical period. That's not a signal. That's memorization.
Practical rule: if your backtest result depends on parameters being precise to two decimal places, the result is almost certainly noise.
In-Sample vs. Out-of-Sample: The Minimum Standard
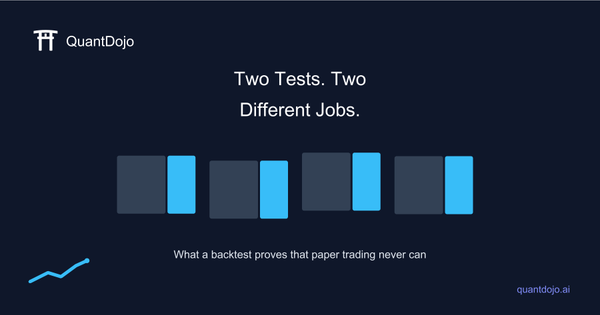
The standard fix for curve-fitting is splitting your data into two non-overlapping periods.
- In-sample (IS): The period you optimize on. The optimizer is allowed to see this data.
- Out-of-sample (OOS): A period held back entirely. The optimizer never touches it.
You optimize on IS, then run the best parameters on OOS once, without further adjustment. The OOS result is your honest read on whether the strategy generalizes.
A few realities about this approach:
- OOS performance will almost always be worse than IS. That's expected. The question is how much worse.
- A large OOS degradation is a red flag. If IS Sharpe is 2.1 and OOS Sharpe is 0.3, the gap is telling you the IS result was mostly noise.
- You only get one clean OOS test. The moment you look at OOS results and adjust parameters, that data is contaminated — it's effectively become IS data.
This is where most retail traders quietly cheat themselves. They peek at OOS, tweak, re-run, and convince themselves the improved result is meaningful. It isn't. As with lookahead bias, the contamination is invisible in the equity curve.
Walk-Forward Analysis: Multiple Honest Tests
A single IS/OOS split gives you one data point. Walk-forward analysis (WFA) gives you many.
The mechanics:
- Optimize on an IS window (say, 12 months).
- Test on the next OOS window (say, 3 months). Record the result.
- Roll the window forward. Repeat.
- Stitch together all the OOS segments into a single equity curve.
That combined OOS curve is your real performance estimate. It reflects how the strategy behaved across multiple market regimes, each time with parameters that had never seen the test period.
Walk-forward is harder to implement than a single split, but it's also much harder to fool. A strategy that survives multiple WFA cycles with consistent — not necessarily spectacular — OOS performance has earned more credibility than any single backtest.
Look for two things in WFA output: - IS/OOS efficiency ratio: OOS Sharpe divided by IS Sharpe. Anything above 0.5–0.6 is respectable; below 0.3 suggests heavy fitting. - Consistency across windows: You want OOS periods that are mostly profitable, not one monster window masking six losers.
The Deflated Sharpe Ratio: Accounting for How Many Combinations You Tried
The standard Sharpe Ratio has a blind spot: it doesn't know you tested 3,000 parameter combinations before reporting the best one.
The Deflated Sharpe Ratio (DSR), developed to address the multiple-testing problem, adjusts the Sharpe downward based on: - The number of trials you ran - The length of the backtest - The skewness and kurtosis of returns
The intuition is simple: if you test enough combinations, even pure noise will produce a high Sharpe by chance. DSR estimates what the Sharpe would look like after correcting for that luck. A strategy that survives DSR scrutiny has demonstrated performance that's statistically unlikely to be random — even accounting for how hard you looked.
Practically, this means: - A Sharpe of 1.8 from 10 trials might be meaningful. DSR stays close to the raw Sharpe. - A Sharpe of 1.8 from 5,000 trials is almost certainly noise. DSR deflates it toward zero.
This is why reporting the number of strategies or combinations you tested is an act of intellectual honesty, not self-incrimination. Without it, no one — including you — can evaluate what the Sharpe actually means. Survivor bias compounds this further: you only see the strategies that looked good, never the graveyard of failures that shaped your priors.
Run the Validation Before You Risk Anything
Most of these checks — parameter stability, IS/OOS comparison, DSR, walk-forward efficiency — can be run systematically before you fund a single live trade.
QuantCheck is QuantDojo's free no-code validation tool built specifically for this. Paste in your backtest results and it runs the statistical battery: overfitting diagnostics, Deflated Sharpe, Monte Carlo stress tests. No signup required to get the verdict.
If your strategy looks great in the optimizer but you haven't run it through a structured out-of-sample validation, you don't yet know whether you have an edge. You know you have a good fit to historical noise — which is a very different thing.
Try QuantCheck free — no signup needed and find out before the market tells you the hard way.
Frequently Asked Questions
How many parameters is too many for a trading strategy?
There's no universal number, but a useful heuristic is that each free parameter requires roughly an order of magnitude more data to validate reliably. A strategy with five optimized parameters needs substantially more backtest history than one with two — and even then, walk-forward testing and DSR are essential to confirm the result isn't just data mining.
What's the difference between curve-fitting and overfitting in trading?
The terms are often used interchangeably, and the underlying problem is the same: a model that fits historical noise rather than a repeatable signal. "Curve-fitting" usually refers specifically to parameter optimization — tuning settings until the backtest looks perfect. "Overfitting" is the broader concept, covering anything from too-complex entry rules to a strategy with so many conditions it only worked during one specific market regime.
Does a high Sharpe ratio mean my strategy isn't curve-fit?
No — and this is the dangerous misconception. A high Sharpe ratio from an optimization run is evidence of a good optimizer, not a good strategy. The Sharpe only becomes meaningful when it's measured on data the optimizer never touched, and ideally after applying a Deflated Sharpe correction for the number of combinations tested. Raw in-sample Sharpe, on its own, tells you almost nothing about forward performance.
The honest bottom line: optimization is a tool, not a shortcut. Used carefully — with held-out data, walk-forward validation, and Deflated Sharpe — it can sharpen a strategy that already has real edge. Used carelessly, it manufactures the illusion of edge and destroys capital with mathematical precision.
Test your parameters. Flatten your surface. Validate out-of-sample. Then validate again.
Nothing in this article is financial advice — it's a statistical argument for intellectual honesty before you put real money on the line.