Monte Carlo Simulation for Trading Strategies: What It Can and Cannot Tell You
Your backtest shows one equity curve. Reality will hand you thousands of possible ones. Monte Carlo simulation maps that entire landscape — but most traders misread the map.
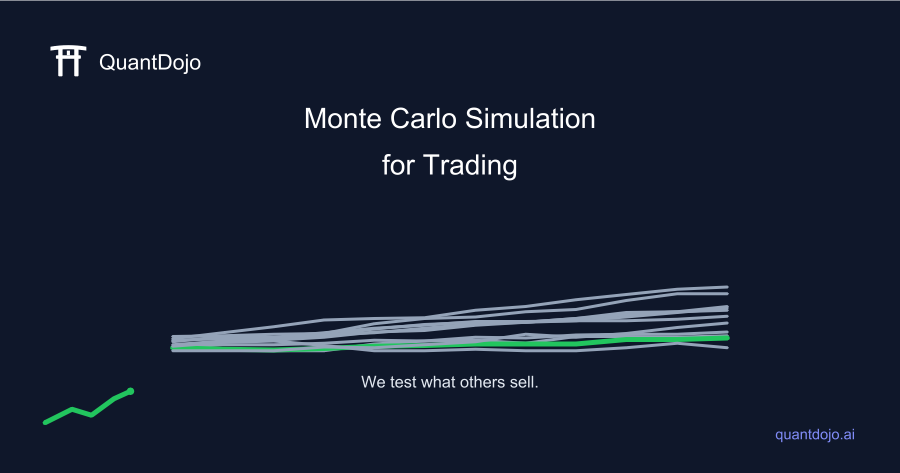
Your backtest produced exactly one equity curve. That curve is a single sample path — one roll of a die with thousands of faces. Monte Carlo simulation for trading strategies forces you to look at all the other faces before you put money on the table.
The technique is straightforward: take your historical trade sequence, shuffle it thousands of times, and measure what the distribution of outcomes looks like. No exotic math. No assumptions about normality. Just your own trades, rearranged, telling you how bad things could plausibly get.
That honesty is both Monte Carlo's greatest strength and the reason most traders misuse it.
What Monte Carlo Simulation Actually Does
A standard backtest replays trades in the exact order they occurred. That order is partly strategy and partly luck — the luck of which winning trade happened to arrive after a losing streak, which losing trades clustered together, which month happened to be flat.
Monte Carlo resampling breaks that lock-in. At each iteration, it draws trades randomly — with replacement — from your historical trade record and recomputes the equity curve. Run 5,000 iterations and you have 5,000 plausible equity curves generated from the same underlying edge (or lack thereof).
From that distribution, you can extract things your single backtest never showed you:
- Maximum drawdown at the 95th percentile — not the drawdown you saw, but the drawdown you could expect to see roughly one time in twenty.
- Terminal equity range — the spread between a good run and a bad run of the same strategy, expressed as a dollar or percentage band.
- Risk of ruin — the fraction of simulated paths that hit a catastrophic drawdown threshold before reaching your profit target. This is arguably the most important number in trading, and your backtest's single equity curve cannot compute it.
Why Your Single Backtest Equity Curve Is Misleading
Imagine you ran a strategy for two years and it produced a 22% drawdown. Was that a bad run, a typical run, or a lucky run? You cannot know from one path.
Monte Carlo answers the question. If the 5th percentile of simulated drawdowns is 18% and the 95th percentile is 41%, then your observed 22% sits near the optimistic end. Live trading will eventually hand you a draw from that full distribution. Sizing for 22% while the 95th-percentile reality is 41% is a fast way to blow a prop-firm account — or your own.
This connects directly to prop-firm risk management. If you are prepping for a challenge with a 10% max-drawdown rule, the statistics of passing an FTMO challenge depend entirely on knowing where your realistic worst drawdown sits — not where your single backtest's drawdown sat. Monte Carlo is what bridges that gap.
For a quick sanity check on how deep a drawdown you can survive before the math works against you, the Drawdown Recovery Calculator shows you the asymmetric hole you are climbing out of.
How to Run It: The Resampling Method
There are two dominant approaches.
Trade-sequence resampling (bootstrapping)
This is the most common and most practical method for retail algo traders.
- Collect your list of closed-trade P&L values (e.g., +1.2R, -1R, +0.8R, -1R, +2.1R …).
- Sample n trades randomly with replacement, where n equals the number of trades in your original backtest.
- Compute the equity curve, record max drawdown and terminal equity.
- Repeat 5,000–10,000 times.
- Build the histogram of outcomes.
No coding required — the QuantDojo Monte Carlo Trade Simulator does this in seconds from a trade list you paste in.
Return-stream permutation
Instead of individual trades, some practitioners resample daily or weekly returns. This preserves the return magnitudes while shuffling their sequence. It is useful when you have a continuous returns stream rather than discrete trade records, and when autocorrelation in the original sequence might matter.
Both methods share the same core assumption: the future trade distribution looks roughly like the past trade distribution. That assumption is the simulation's Achilles' heel — more on that below.
Reading the Output: The Numbers That Actually Matter
Maximum drawdown at the 95th percentile
This is your stress-test drawdown. Size your position and set your stop rules so you can survive this number — not so you can survive your backtest's single-path drawdown. If the 95th-percentile drawdown is 35% and you are running 2% risk per trade, do the math before going live.
Risk of ruin
Define ruin as a drawdown threshold you cannot recover from — either psychologically, contractually (prop-firm), or mathematically. Monte Carlo counts the proportion of simulated paths that cross that threshold. A 3% ruin probability sounds reassuring until you remember you only have one account. For a deeper look at the math, the Risk of Ruin Calculator lets you model this directly from win rate, reward-to-risk, and risk per trade.
Terminal equity percentiles
The gap between the 10th and 90th percentile of terminal equity after N trades tells you how much of your performance is luck versus consistent edge. A strategy with genuine edge shows a narrow band that shifts upward. A coin-flip strategy shows a wide band centered near zero. Wide bands after large trade counts are a red flag.
What Monte Carlo Cannot Tell You
This is where most tutorials stop being honest. Monte Carlo has hard limits.
It cannot rescue a contaminated trade sample. If your backtest has lookahead bias baked in, every resampled path inherits that bias. You are bootstrapping phantom trades. The simulation will look great. The live account will not.
It cannot fix an overfit strategy. If your parameters were curve-fitted to the historical window, the trade distribution you are resampling is itself a product of overfitting. Monte Carlo will faithfully simulate thousands of paths from a strategy that was already tuned to look good — and give you false confidence in the process.
It cannot predict regime change. Resampling assumes stationarity: that tomorrow's trade distribution resembles the historical one. A strategy that worked in a low-volatility trending regime will hand you a completely different trade distribution in a mean-reverting choppy regime. Monte Carlo has no way to model that shift.
Small trade counts kill reliability. Bootstrapping 50 trades produces results that are extremely sensitive to a handful of outliers. At minimum, aim for 200+ closed trades before treating Monte Carlo output as meaningful. With fewer trades, widen your confidence intervals mentally — the simulation's apparent precision is an artifact.
It is not a significance test. A Monte Carlo simulation cannot tell you whether your edge is statistically real or a product of chance. For that, you need something like a permutation test against a null hypothesis — which is a different tool entirely. Passing Monte Carlo stress-testing means your strategy is not obviously fragile; it does not mean the edge is genuine.
The Honest Place Monte Carlo Sits in Your Workflow
Think of validation as a sequential filter, not a single gate.
- Clean the data first. Remove lookahead bias. Quantcheck can flag structural red flags in your backtest before you waste time simulating a broken strategy.
- Check for overfitting. Walk-forward analysis and Probability of Backtest Overfitting (PBO) tests belong here.
- Run Monte Carlo to stress-test drawdown, ruin risk, and equity-curve dispersion on a clean, unfit trade record.
- Size accordingly. Use the 95th-percentile drawdown — not the single-path drawdown — as your sizing anchor.
Monte Carlo is not step one. It is the stress test you run after the strategy has earned the right to be stress-tested.
Run It Now, Before You Commit Capital
If you have a list of closed trades — from freqtrade, TradingView, MT4, or anywhere else — paste them into the QuantDojo Monte Carlo Trade Simulator and see what the full distribution of outcomes looks like. The tool runs 5,000 iterations and returns the drawdown distribution, terminal equity percentiles, and ruin probability against a threshold you set.
Then — if the strategy passes that filter — take the backtest itself through QuantCheck to check for overfitting before going live. No signup required for a verdict.
Frequently Asked Questions
How many Monte Carlo iterations do I need for reliable results?
In practice, 5,000 iterations is sufficient for most retail strategy validation purposes — the percentile estimates stabilize well before that. Running 10,000 adds marginal precision. What matters far more than iteration count is trade-sample quality and size: 5,000 iterations on 40 trades will still produce unreliable estimates, because you are resampling a tiny and potentially unrepresentative population.
Does Monte Carlo simulation prove my strategy has real edge?
No. Monte Carlo simulation tests fragility, not significance. A strategy that survives Monte Carlo stress-testing is confirmed to be not catastrophically sensitive to trade ordering — that is a necessary condition, not a sufficient one. Proving statistical significance requires a proper hypothesis test, such as a permutation test against a randomized null, not a bootstrap of the observed trade sequence.
How is Monte Carlo different from walk-forward analysis?
Walk-forward analysis tests whether a strategy's parameters generalize across time by training on one window and testing on the next — it is primarily an overfitting diagnostic. Monte Carlo simulation takes a fixed trade record and stress-tests the distribution of outcomes from that record — it is primarily a risk and fragility diagnostic. They answer different questions and belong at different stages of validation. Neither replaces the other.
Nothing in this article is financial advice — it is education about statistical methods for evaluating trading strategy risk.