Paper Trading vs Backtesting: What Each One Can and Cannot Prove
Both look like validation. Neither is sufficient alone. Here's exactly what each test can and cannot prove — and why confusing them costs traders real money.

Both look like validation. Neither is sufficient alone. Here's exactly what each test can and cannot prove — and why confusing them costs traders real money.
Most stock picking services sell you a backtest disguised as a track record. Here's the buyer's checklist to tell the difference before you hand over a cent.
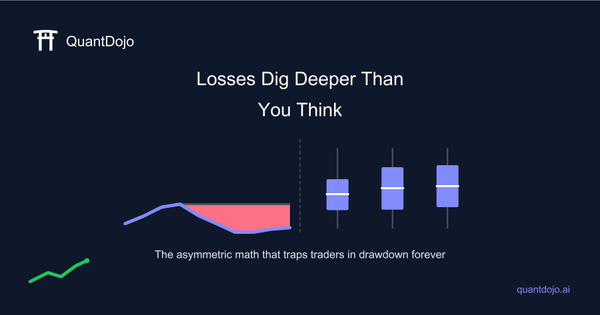
A 50% drawdown doesn't need a 50% gain to recover — it needs 100%. The math is asymmetric, it compounds against you, and most traders never look at it clearly until it's too late.
Three metrics, three different definitions of risk — and optimizing for the wrong one can make a losing strategy look brilliant. Here's which one actually matters for your strategy.
Most strategy vendors sell you the backtest they want you to see. Here's the systematic checklist that exposes what they're hiding.
Your backtest looks great — until you actually trade it. Slippage is the silent tax that turns winning strategies into losers, and most backtests ignore it almost entirely.
The golden cross is one of the most cited signals in retail trading. We ran the numbers — commission-adjusted, out-of-sample, across four asset classes — so you don't have to take anyone's word for it.
Suspecting your backtest is overfit is not the same as knowing. The PBO score turns that suspicion into a number — here's how it works and what to do with it.
A Sharpe of 2.1 sounds bulletproof. The Deflated Sharpe Ratio shows it's probably not. Here's the math that exposes why.
RSI(2) is one of the most cited mean-reversion setups in retail trading. We ran it through rigorous, multiple-testing-corrected validation to find out whether any real edge survives.
Run enough backtests and you'll find a 'winning' strategy by pure chance. That's not edge — that's p-hacking, and it's more common than you think.
A single in-sample/out-of-sample split feels rigorous — it isn't. Walk-forward analysis is the only test that mimics how a strategy actually ages in the market.
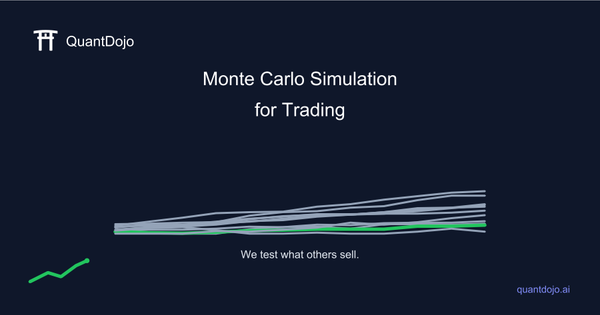
Monte Carlo
Your backtest shows one equity curve. Reality will hand you thousands of possible ones. Monte Carlo simulation maps that entire landscape — but most traders misread the map.

survivorship bias
Test a strategy on today's top coins or stocks and you've already rigged the result. Survivorship bias quietly inflates every backtest that ignores the assets that died.
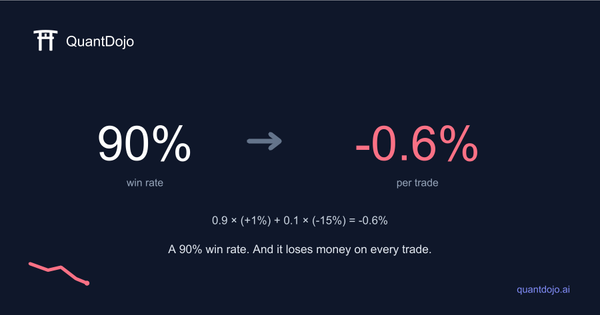
Win Rate
Win rate is the most cited and most misleading number in trading. Here's how a strategy that wins 90% of the time can still bleed you dry — and what to track instead.
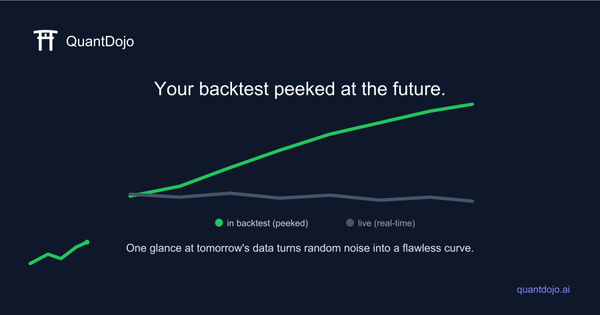
Lookahead Bias
Lookahead bias is the quietest backtest killer: a single accidental glance at future data turns random noise into a flawless equity curve. Here's how it sneaks in — and how to catch it.
prop firms
A high Sharpe ratio and a smooth equity curve aren't enough to pass an FTMO challenge. Here's how to map your backtest statistics to prop-firm rules before you risk the fee.
overfitting
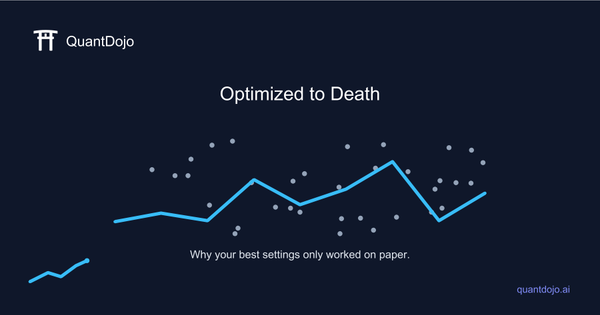
You ran the optimizer, found the best settings, and the backtest looks great. That's exactly the problem. Here's why optimized strategies die in live trading — and the two tests that catch it first.
backtesting
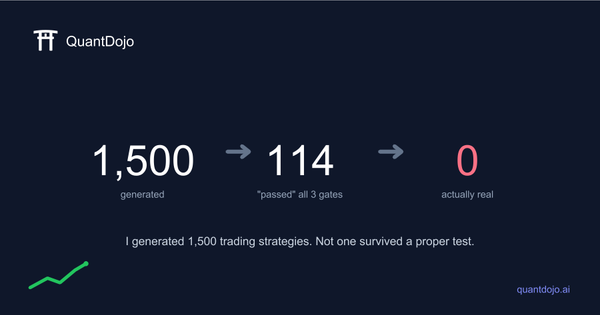
A hands-on demonstration of why in-sample / out-of-sample / holdout testing isn't enough to catch overfitting — and the statistics that actually are.